An article from Jim Babbage on Adobe’s Blog, via Creating Static and Interactive Infographics with Illustrator and Muse.
Creating Static and Interactive Infographics with Illustrator and Muse
This week, the team I work on at Adobe was given a special task; to create new education-based assets to use in demonstrations, tutorials and to share with educators and other education colleagues. The main idea being to produce content that could be considered usable from a “non-designer/arts” perspective.We worked in teams. My team consisted of me and my colleague Steve Adler (also a former educator, like I am). We’ve both been amazed by the great new goal-based tutorials that can be found on AdobeforAcademics, and in particular, we were inspired by the timelapse video tutorial that can be found there. It’s a very thorough tutorial on using Premiere Pro to create a timelapse video.
An Holistic Approach
However, I wanted something that could be a little easier and more approachable for a teacher new to using technology – especially our technology, so Steve and I decided that part of our project would be to create the timelapse using Photoshop CC video tools, which are more limiting than Premiere, but also much less intimidating for a newcomer. We also wanted our end result to go beyond a single application or goal. We asked ourselves, what else can we do, how can we round this out, expand on that one single timelapse and create a collection of assets around this theme?
We narrowed the project down to about 4 main deliverables:
- New timelapse video using Photoshop
- Static Infographic
- Animated, web-based infographic
- Acrobat PDF portfolio
I took on the creation of the infographic in all its forms, and Steve took on the video and Acrobat segments. Steve will tell his story in a more detailed manner in his own post; I’ll talk to you about my adventures building out the infographic and Muse-based animated version.
From Facts to Form and Function
I turned to Google first for some research data; I wanted more than just population density metrics for my project. And boy did I get more! I was able to locate historical statistics on visitors to Vegas, gambling income for the Clark County, and even some foreclosure data.I had the makings of an infographic!
Next was to start thinking design; the whole idea behind an infographic is to communicate information quickly and in a visually interesting manner. Iconography gets used a lot in infographics and while you can create your own illustrations (I did for a couple elements) there is also an excellent variety of free-to-use icons that can be found online. Just make sure, before falling in love with an icon set, that you really do have permission to use and publish those icons. In my case, I’d be sharing the content online and quite likely in a blog post too, so I made sure I had a set of graphics that were free to use any way I liked.
Remember, Royalty-free does not necessarily mean FREE (or free to use everywhere).

I started my project using InDesign (ID) as my layout tool and actually completed my first draft of the graphic there, exporting out a jpeg for feedback. I shared it through my Creative Cloud account, which also has the added benefit of storing revision data, so I could see both my first AND second draft. Pretty cool, if you ask me.
With the first real version of my infographic created, it was time to start getting all those visuals into Muse, or so I thought. This was not a particularly easy task going from InDesign, and there was something I just wasn’t happy with. I can’t recall if it was a lack of control, or I wasn’t happy with the image quality. Anyway it was something and coming from years of working with Adobe Fireworks as a web designer, I can be very picky on image quality.
So, I opted to first move over to Illustrator (AI), because I could copy and paste vector objects and text quickly and easily from ID to AI, and slice/export objects easily from AI for use in Muse.

Normally I would have gone the Fireworks (FW) route, but copying and pasting any object from ID to FW resulted in bitmaps (even text!), and I wanted to retain the flexibility of using vectors. In fact if I was starting over completely, or considering going out to Edge Animate, I would probably have gone to Fireworks. There’s a great Edge Animate export workflow created for Fireworks by John Dunning, which would have saved me loads of time if that had been my goal.
Anyway, I rebuilt the layout in Illustrator in very short order and even made several updates as new data came in. I used the Selection tool and the Slice tool to create and export out web-ready graphics from Illustrator over to my Muse folder.

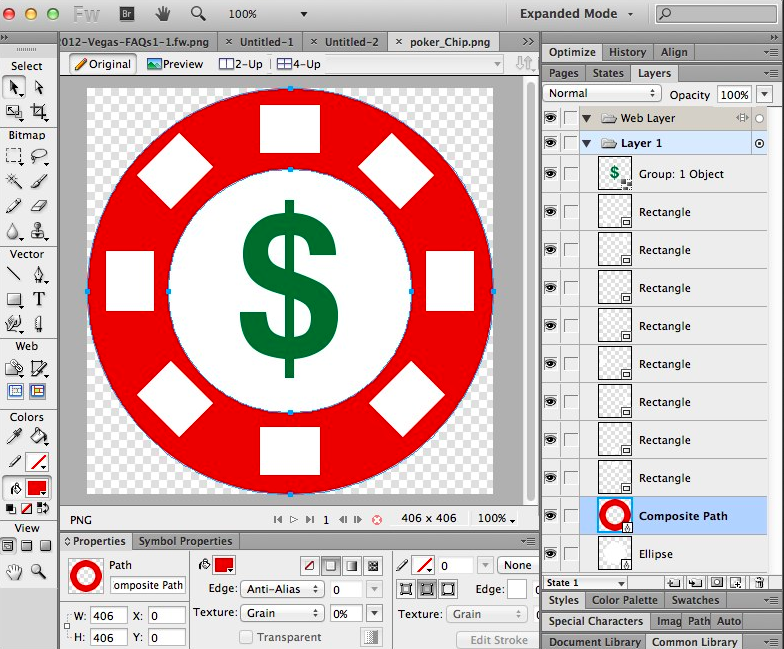
For the gambling section of my graphic, I really wanted to use a poker chip to represent money (in the billions) that the gambling industry rakes in. I did a search for a poker chip icon and the only vector one I found was one I had to purchase. Now the cost was only 1 dollar, but I figured I could mock up the poker chip easily enough in Fireworks or Illustrator. Being far more comfortable with Fireworks, I used my favourite app to build the chip in less than 15 minutes, including exporting out as an AI file for use in Illustrator.
I also created the dice, but opted to use Illustrator this time, so I can say that I built my own graphics and did so in two different programs. Simple graphics, but my own, nonetheless.
At which time, I fired up Muse and created a single page site. I dropped a screened-back version of the Vegas map into the Master page and set about creating my new layout.
(Mis)Adventures with Muse
Don’t let the headline mislead you; I really like Muse. If I was still teaching, this app would be a core part of my advertising and photojournalism courses, hands-down! But as I’m fairly new to Scroll Motion effects in Muse, I had a thing or three to learn.
At this point, let me share with you my first mistake. See, my goal was to use the new Scroll Motion feature of Muse to create an animated version of my infographic. Something interactive and fun and useful, to boot. Otherwise, well, I might as well just insert an image into a blog post and be done. But when I created my initial page dimensions, I based them off the actual artwork. That makes sense, you might say, but in actuality, for scroll motion to work (at least the way I wanted it to work), the page had to be significantly longer. At least 30% longer in my case. Applying Scroll Motion effects can be a little tricky, but you can learn more about this Muse feature by watching this Muse Jam Session.

My second mistake was visualizing all these elements – graphics and text – flying about the screen in some intricately choreographed dance as I scrolled downward. Now, I’m not saying that level of animation isn’t possible, but when you’re new to working with scroll motion, take my advice and keep it simple to begin with. I ended up (more due to time constraints) grouping the various sections of my infographic and animating them as groups, rather than a bunch of individual objects. As I become more proficient, this will likely change.
My next tip is: Before you fall in love with a font, make sure you have access to it everywhere. I started out with the western-style font you see in the infographic, but when I switched to Muse, I had the bright idea of using webfonts, and I found a font I liked even better, and used it for my Muse site.

But, when I went to replace the western font in Illustrator, I discovered that this font is not yet available as a desktop font. ![]() Oh well, for the time being, I’m leaving things as they are, but I’ll likely have to switch my the font in Muse to something that looks more like the static infographic.
Oh well, for the time being, I’m leaving things as they are, but I’ll likely have to switch my the font in Muse to something that looks more like the static infographic.
The end result is a vibrant, easy to understand infographic that one can view, and a dynamic, interactive web version that people can experience. By working with an tools like Illustrator, Fireworks and Muse, I created quality work faster and far more easily than ever.

Combined with my ability to share this content on both the Creative Cloud for feedback, and Behance for sharing and comments,the experience has been a great one. I’m looking forward to creating more infographics, now, and perhaps incorporating other imagery, like my own photographs.