Here’s an excellent article from Rachel Banning-Lover on The Guardian, intended particularly for NGOs and relief workers, via the Global Development Professionals Network | Guardian Professional. How to make infographics: a beginner’s guide to data visualisation An interactive map of attacks on health care in Syria – the blue spots show attacks by government forces. Photograph: Physicians for Human … Read More
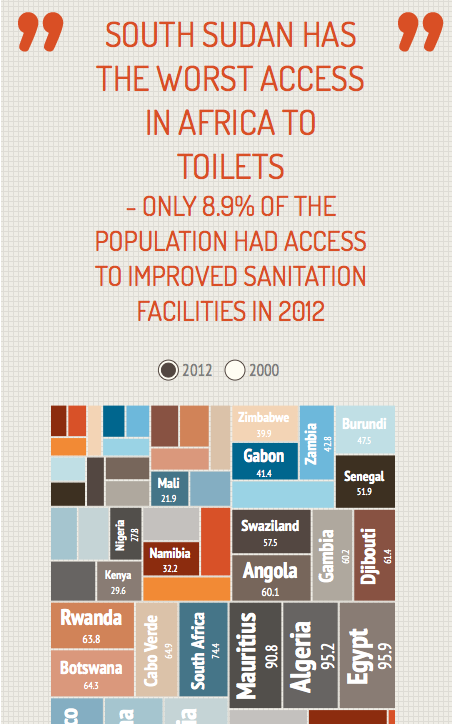
Creating Static and Interactive Infographics with Illustrator and Muse
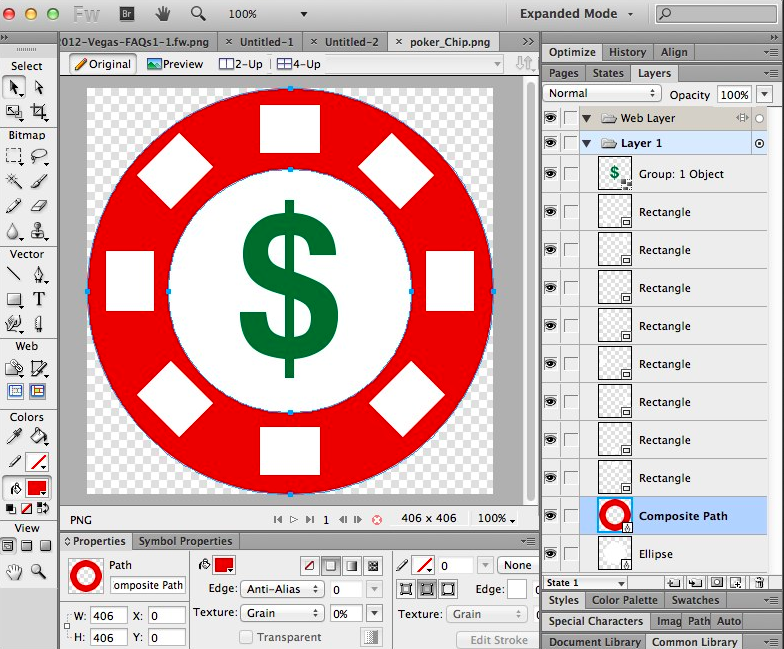
An article from Jim Babbage on Adobe’s Blog, via Creating Static and Interactive Infographics with Illustrator and Muse. Creating Static and Interactive Infographics with Illustrator and Muse This week, the team I work on at Adobe was given a special task; to create new education-based assets to use in demonstrations, tutorials and to share with educators and other education colleagues. … Read More