Here is a presentation from Joe Golike, a data viz designer at Trulia, about how you can use the Javascript language/library D3 to make visualizations that are interactive, lively. It’s from SF a few years ago. And the slides for the presentation: Introduction to D3 from Visually
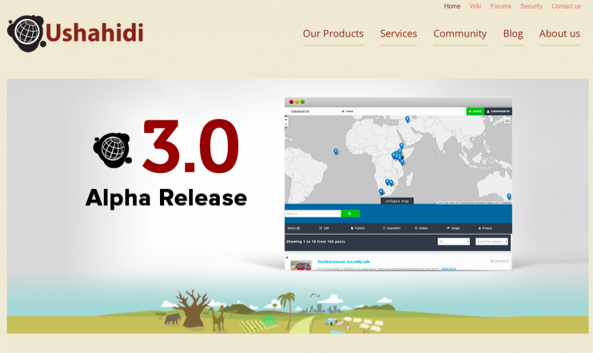
Build a Crowdsourced Map with Ushahidi
Ushahidi is a platform to develop a crowdsourced map of information. Here is its Github repository. The Ushahidi Platform is an open source web application for information collection, vizualisation and interactive mapping. It allows people to collect and share their own stories using various mediums such as SMS, Web Forms, Email or Twitter. For more information about the platform and … Read More
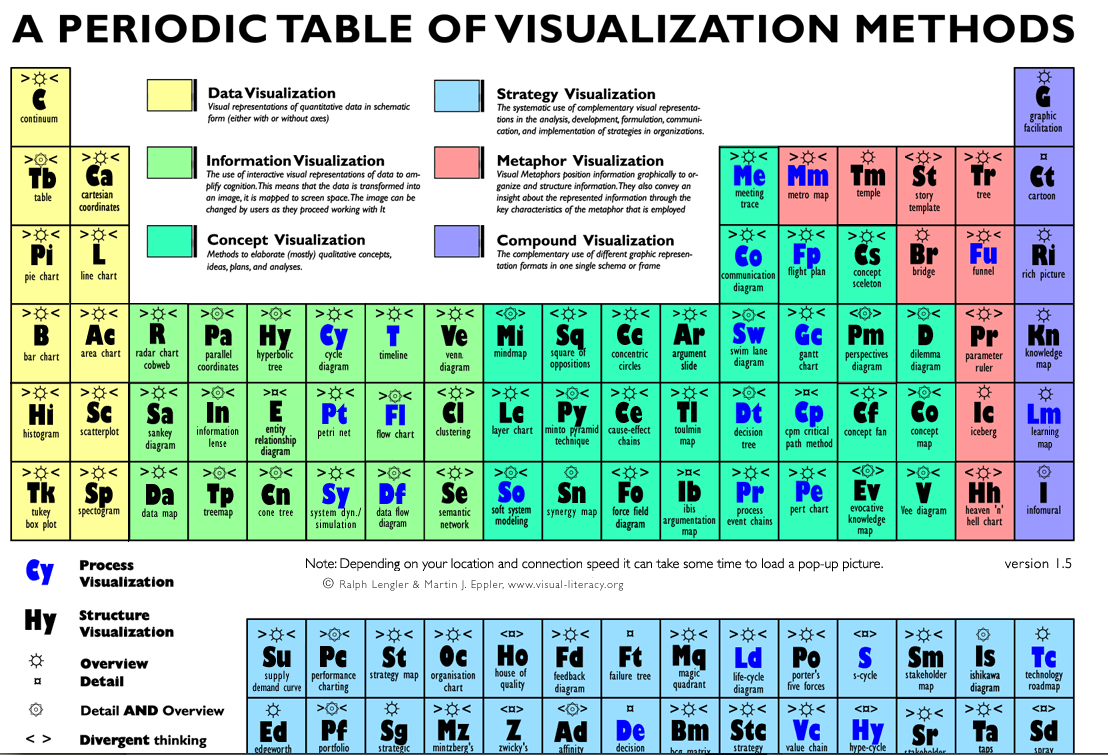
A Periodic Table of Visualization Methods
A Periodic Table of Visualization Methods. from Ralph Lengler & Martin J. Eppler at www.visual-literacy.org This interactive table presents a systematic overview of tools to use when trying to visualize different things — and hover over any of the types, and see an example of exactly that pop-up. So cool & useful!
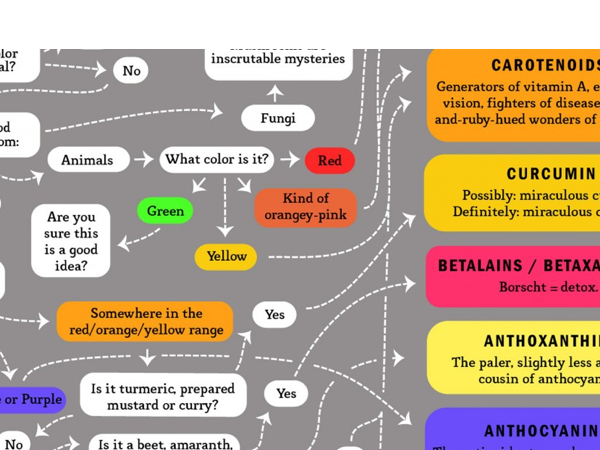
Visualization for Lawyers
Welcome! This Visualization for Lawyers page will be a running resource for lawyers, law students, paralegals, and other people coming from the legal profession who want to learn how to visualize their content in more effective ways. First is a Typology: a guide to what tools you use for a specific type of communication you want to achieve. Second are Resources: … Read More
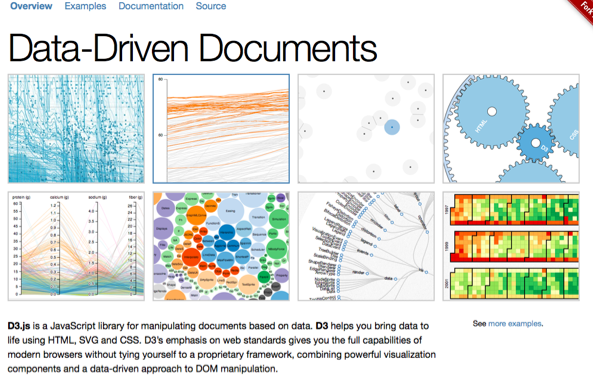
Make Interactive Visuals with D3
D3 is a way to make interactive visualizations from datasets, that you can display online, embedded in HTML. Make complex data usable, visible, and powerful! How to use D3 in your project? I you know how to use JavaScript, you’re off to a great start. For people who want to look through a bunch of tutorials and exercises, check out … Read More
