
This article, by Helena Haapio and Stefania Passera, was published on VoxPopulii, Cornell’s Legal Information Institute, May 15, 2013. For decades, words have been lawyers’ tools of trade. Today, we should no longer let tradition force us to think inside the text-only box. Apart from words, there are other means available. It is no longer enough (if it ever was) to … Read More
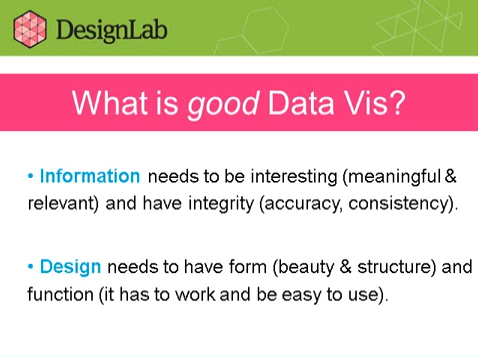
Information & Design in Data Vis
▶ I Like Pretty Graphs: Best Practices for Data Visualization Assignments – YouTube | Program for Legal Technology & Design.
A Periodic Table of Visualization Methods
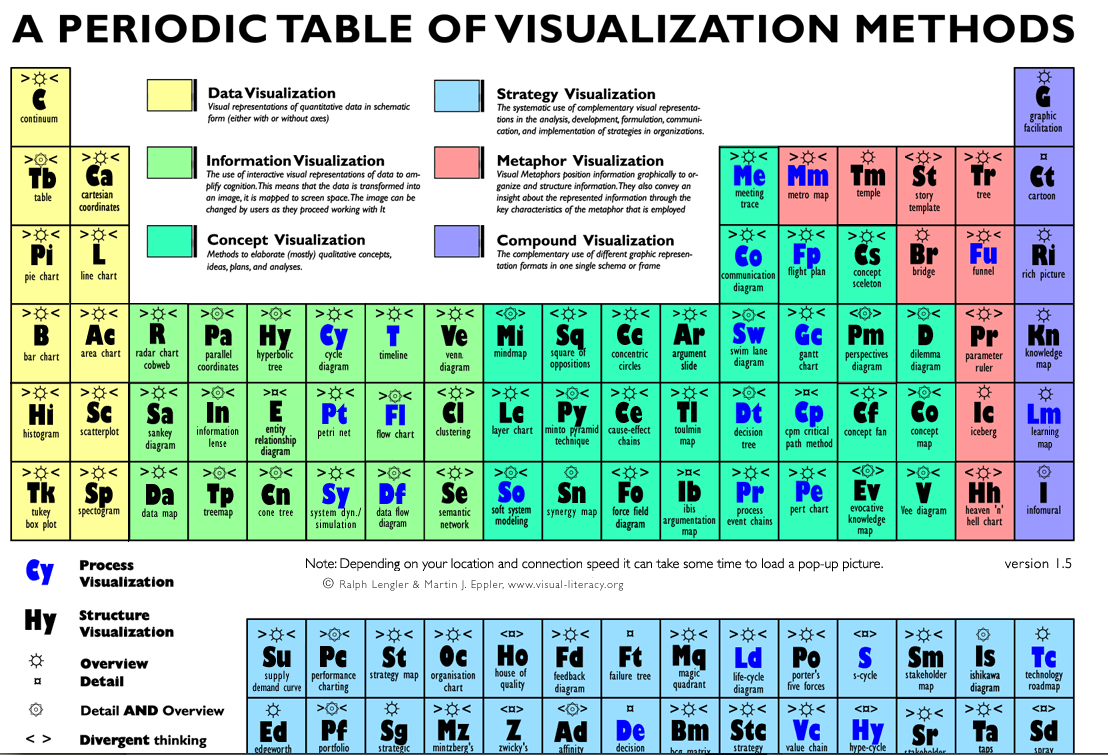
A Periodic Table of Visualization Methods. from Ralph Lengler & Martin J. Eppler at www.visual-literacy.org This interactive table presents a systematic overview of tools to use when trying to visualize different things — and hover over any of the types, and see an example of exactly that pop-up. So cool & useful!
▶ I Like Pretty Graphs: Best Practices for Data Visualization Assignments – YouTube

▶ I Like Pretty Graphs: Best Practices for Data Visualization Assignments – YouTube. The DesignLab from University of Washington has a great (hour long) presentation about how to integrate data visualizations into typically non-data-driven, non-visual classes in a university. It can also be bridged into law school classrooms, as a beginner intro to data visualization and its potential to integrate … Read More
How to create a Swim-Lane Diagram

A swim-lane-diagram is a type of flowchart, and it can be used to display the same type of information. A swim-lane-diagram documents the steps or activities across boarder and show which step and activity belongs to whom throughout processes; that’s why it’s also called a cross-functional-diagram or a cross-channel-diagram. What a swim-lane-diagram makes special and unique is that the elements … Read More