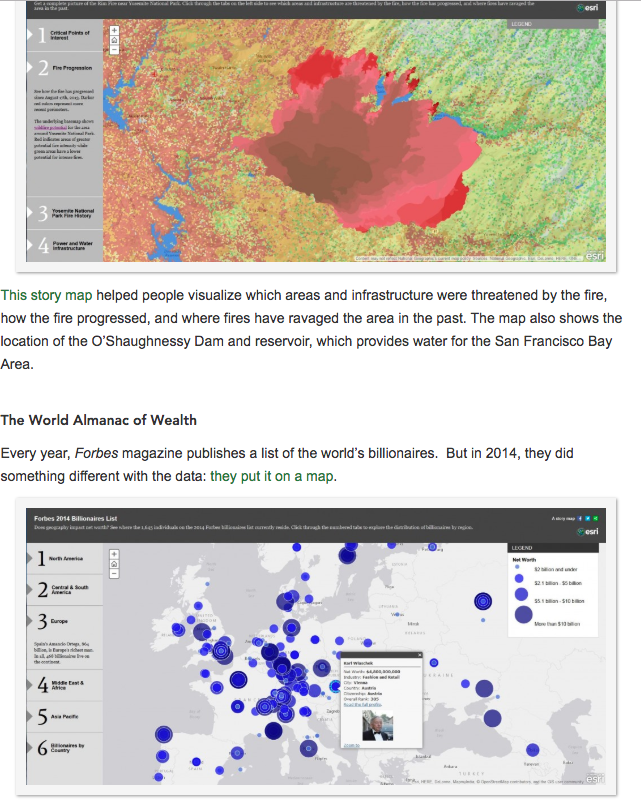
There are lots of good examples in the Esri Insider article, Journalists Embrace Story Maps , that shows a mixture of narrative, policy and news, and GIS mapping of information. It makes the data become more contextual and staged — so hopefully more engaging.
Legal Icon Set on the Noun Project
We have started building a collection of legal-themed icons on the Noun Project that you can download and use in your materials. If you have any requests for more, just write and let us know!
Using Gestalt Principles for better communication design
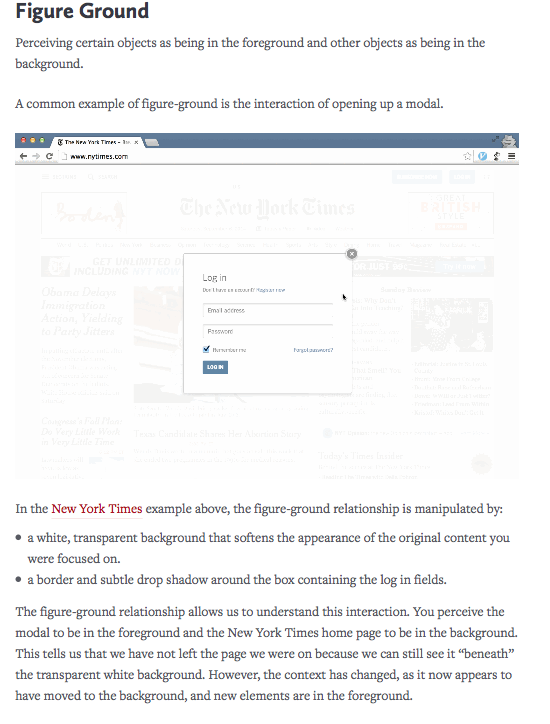
Carolann Bonner has an article, Using Gestalt Principles for Natural Interactions that gives some central communication design principles, based on Gestalt ideas, that are directly relevant to communication & interface designers. Gestalt is a term used in psychology which expresses the idea that the whole of something is more important to our understanding than the individual parts. The Gestalt principles … Read More
Make Infographics with Piktochart

Piktochart is an online, paid tool to create your own infographics easily, by plugging in your data into their templates. You can also create reports, banners, and presentations with their tool. Here is their basic tutorial overview of how to make an infographic with their tools: With Piktochart’s tools and features, you’ll be an infographic making genius in no time. … Read More
Pervasive Information Architecture principles
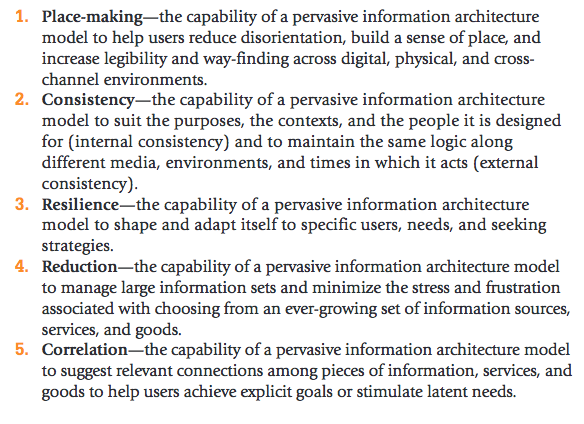
These are central design guidelines, or heuristics, from the book Pervasive Information Architecture. by Andrea Resmini and Luca Rosati, with a website with more information here.
Testing your visual designs
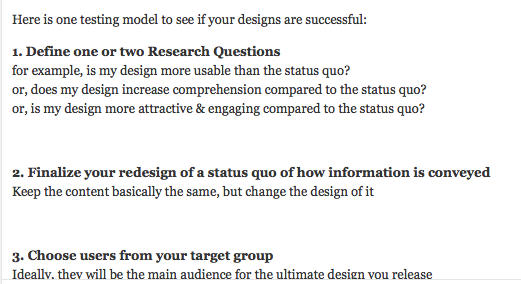
Here is one testing model to see if your designs are successful: 1. Define one or two Research Questions for example, is my design more usable than the status quo? or, does my design increase comprehension compared to the status quo? or, is my design more attractive & engaging compared to the status quo? 2. Finalize your redesign of … Read More
Corporate document redesign
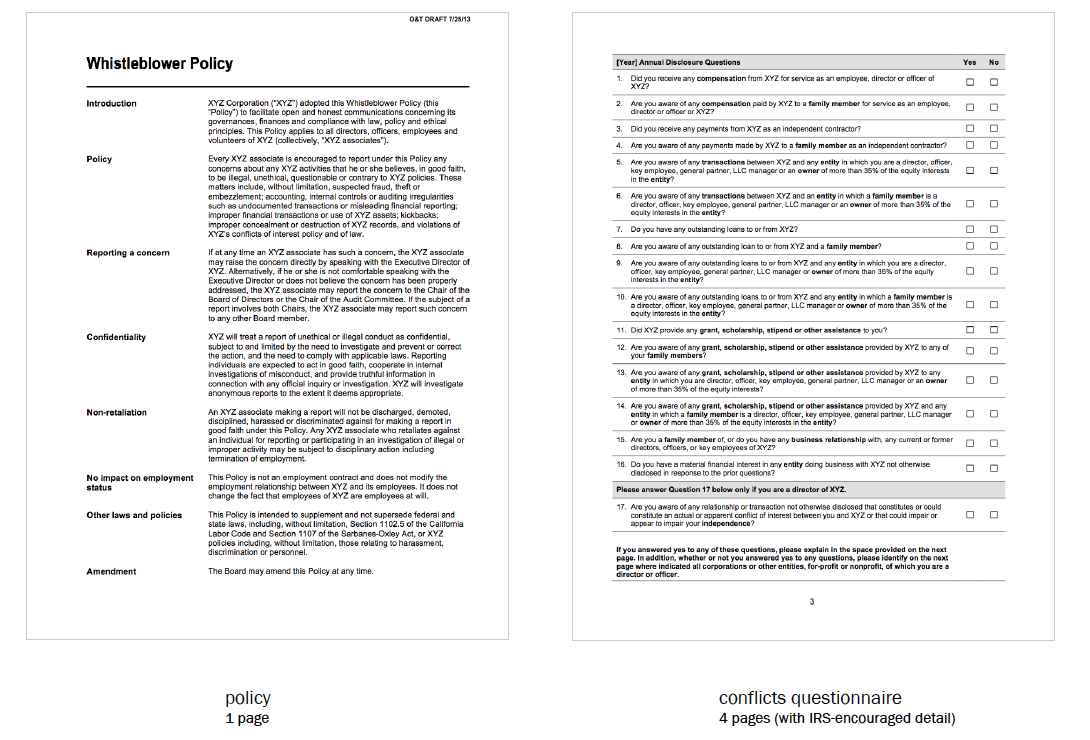
From Jay Mitchell, clinical professor at Stanford Law School, & his paper on Putting Some Product Into Work Product: The abstract of his paper: Clients hire corporate lawyers to make useful things for them. Those things are documents, such as contracts and corporate bylaws. Lawyers have some good tools for making these products; standard forms and precedents from prior engagements … Read More
Terms of Service Redesign study
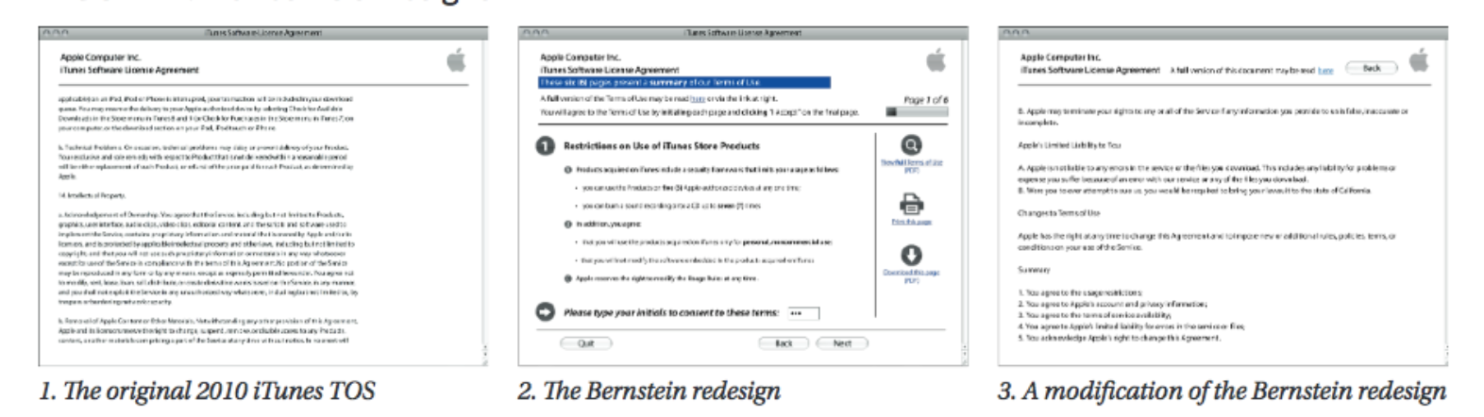
The Center for Media Design at Ball State University published a short paper on iTunes Terms of Service Redesign. They used a Savannah design student’s proposed modifications to Apple’s TOS design as a jumping off point to do research as to what design would be successful. Their Research Questions: The purpose of this study was to compare the efficacy of, … Read More
Visual Law: What Lawyers Need to Learn from Information Designers

This article, by Helena Haapio and Stefania Passera, was published on VoxPopulii, Cornell’s Legal Information Institute, May 15, 2013. For decades, words have been lawyers’ tools of trade. Today, we should no longer let tradition force us to think inside the text-only box. Apart from words, there are other means available. It is no longer enough (if it ever was) to … Read More
Information & Design in Data Vis
▶ I Like Pretty Graphs: Best Practices for Data Visualization Assignments – YouTube | Program for Legal Technology & Design.
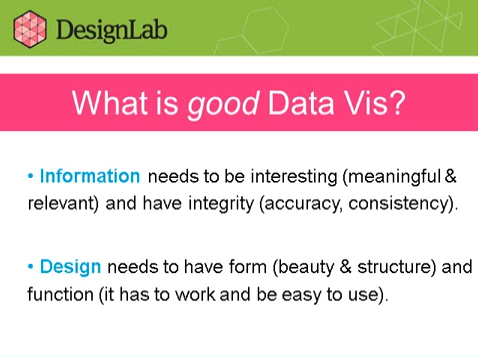
Best Practices for Data Visualization
▶ I Like Pretty Graphs: Best Practices for Data Visualization Assignments – YouTube | Program for Legal Technology & Design. The DesignLab from University of Washington has a great (hour long) presentation about how to integrate data visualizations into typically non-data-driven, non-visual classes in a university. It can also be bridged into law school classrooms, as a beginner intro to … Read More
Visceral Notice Types
Ryan Calo in Against Notice Skepticism in Privacy proposes that we consider Visceral Notice alternatives to language-based notice. Visceral Notice leads consumers to experience information rather than just telling them information. Think of road designers putting speed bumps onto the road, rather than signs saying to slow down. Ryan Calo lists off several types of Visceral Notice: Using a familiarity … Read More
Consumer Comprehension of Financial Privacy Notices
via Consumer Comprehension of Financial Privacy Notices – s70907-21-levy.pdf. This report describes the results of the second phase of a research project focusing on privacy notices that financial institutions are required to provide their customers under the Gramm-Leach-Bliley Act (GLBA). The project goals were to better understand consumer comprehension of privacy notices and to assess the communication effectiveness of several … Read More
Visualization for Lawyers
Welcome! This Visualization for Lawyers page will be a running resource for lawyers, law students, paralegals, and other people coming from the legal profession who want to learn how to visualize their content in more effective ways. First is a Typology: a guide to what tools you use for a specific type of communication you want to achieve. Second are Resources: … Read More
Harvard online course in Data Visualization
Harvard School of Engineering & Applied Science has an online course open to the public on Data Visualization. It was produced in Spring 2013 & still has an online repository of all the lectures, labs & workshops that took place. You can go through the entire semester’s worth of content — including how to use the D3 Javascript library to … Read More
▶ I Like Pretty Graphs: Best Practices for Data Visualization Assignments – YouTube

▶ I Like Pretty Graphs: Best Practices for Data Visualization Assignments – YouTube. The DesignLab from University of Washington has a great (hour long) presentation about how to integrate data visualizations into typically non-data-driven, non-visual classes in a university. It can also be bridged into law school classrooms, as a beginner intro to data visualization and its potential to integrate … Read More
How to create a Swim-Lane Diagram

A swim-lane-diagram is a type of flowchart, and it can be used to display the same type of information. A swim-lane-diagram documents the steps or activities across boarder and show which step and activity belongs to whom throughout processes; that’s why it’s also called a cross-functional-diagram or a cross-channel-diagram. What a swim-lane-diagram makes special and unique is that the elements … Read More
Civic Data Design Lab
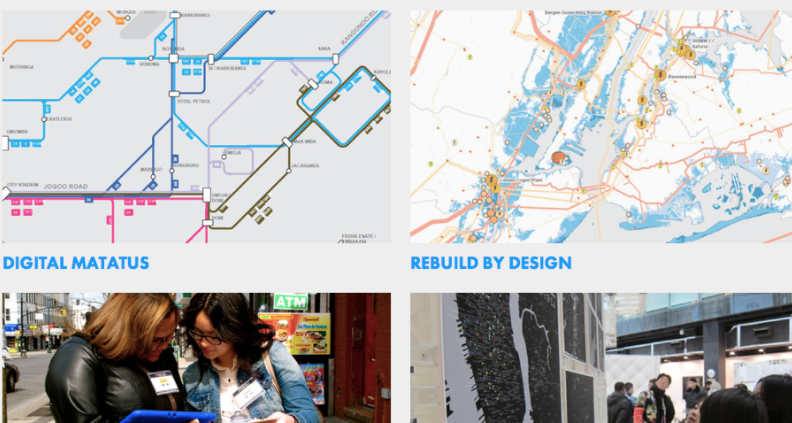
Civic Data Design Lab is a project out of MIT’s Dept. of Urban Studies & Planning, that focuses on how data-based visuals and tools can be used to improve citizenship — and citizens’ relations with the government. From their site: The Civic Data Design Lab works with data to understand it for public good. We seek to develop alternative practices … Read More