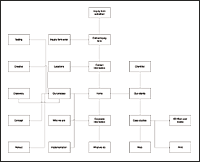
Here is a very instructional piece from Michael Angeles explaining how to use Excel databases & Visio diagramming software to transform a spreadsheet into a flowchart automatically. It requires some up-front planning & design, but it can be worth it if you make a lot of diagrams.
Check out Automating Diagrams with Visio « Boxes and Arrows for the full article.
We have all heard the adage, “Good, Fast, Cheap: Pick any two (you can’t have all three).” The saying might generally be true of the work we produce as designers of information-use environments. Try to test the saying against one of the deliverables we might create—a high-fidelity interface prototype, for example—and see if you can disprove it. You can produce beautiful prototypes in Illustrator, but it will cost you time and money. You can do rough prototypes quickly and cheaply by hand, but the end result won’t look as polished as the Illustrator version.
Turnaround time can be relatively quick if you push your tools to perform for you. Site maps and user flow diagrams are good candidates for automation.
My approach to producing deliverables is to falsify the truism. I do the demanding intellectual work first and then force the tools to succumb to my need to produce seemingly speedy deliverables. The illusion of speed happens because you do the hard work up front—planning, analyzing and documenting your work in doing content inventories, designing user flow, etc. When it is time to realize that work in a document, the turnaround time can be relatively quick if you push your tools to perform for you. In this article I illustrate one method for producing diagrams quickly using software.
The process overview
We probably do most of our intellectual work in preparing deliverables before ever touching a drawing program. When the elements of the information architecture and user experience are defined, we are often expected to produce a polished document to visually represent the information. We can take a semi-automated approach to produce some of these documents using software. Site maps and user flow diagrams are good candidates.
The process I propose assumes that you’ve spent grueling hours doing the work of preparing your content inventory or sketching your user flow diagrams and now want to render your boxes and arrows for presentation. The next step in the process is to take the data produced in that intellectual work and prepare it for use in a diagramming application.
I will illustrate a process that relies on text files exported from Excel and uses Visio to transform those text files into diagrams. You can also use a database management system for this process, but details about using a DBMS are out of the scope of this article.

