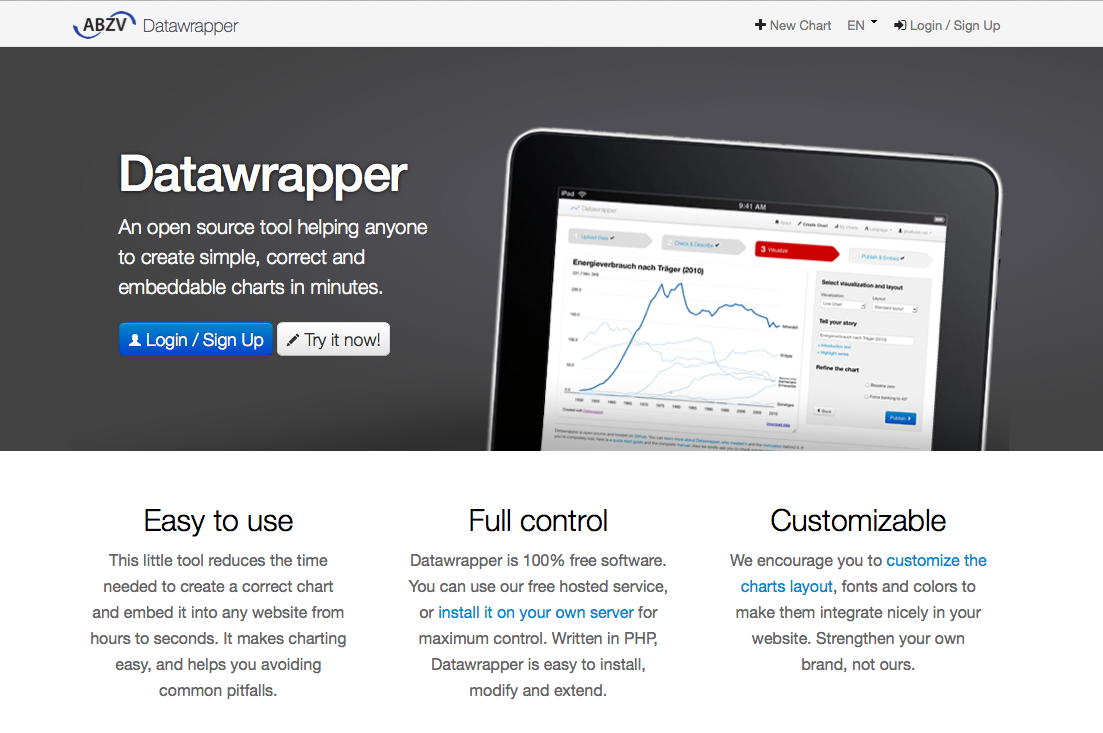
Datawrapper is an open source project started out of a German training institution for newspaper journalists. It is a free software service that lets you easily create correct charts that you can embed online.
Here is their quick start guide:
If you just want to give Datawrapper a try, here is a brief run-through.
Principle: First the data, than the chart
With Datawrapper you can create basic, embeddable charts in four steps. This brief overview provides all information needed to do that. The basic principle is that first there needs to be some data before the best visualization is selected.
Hint: When working with Datawrapper you can go jump between the main steps. All changes you did in one step will be there when you come back. This is useful, e.g. when you need to change the data or do need to transpose it.
Step 1: Preparation of data and insertion into Datawrapper
- Copy data into Excel or an other software for tables
Just make sure to always have a column or line name as a description.- Prepare the data table in Excel or a similar software
Data can come from a Google Table too. You can even try to simply copy an HTML table from the web directly.
Hint: Best results are achieved with cleaned data sets. This means that your data should be free of formatting, dots or comma separators in the numbers and even currency symbols. In bigger projects it is a good idea to focus on one aspect in every visualization. If what can be found in the data is very interesting just do several charts and place them in one article.- Login to Datawrapper when you are done
- Copy Data into Datawrapper
If you are just starting simply use the drop field in the first step to do that, this way you ensure that the data contains just the information, no hidden elements from HTML or other software which sometimes mess up a visualization.Step 2: Check the data
- Just look at it: Is all your data there and displayed as intended?
- Mark the headers: If the first row or line contains headers mark them in Datawrapper (there is a checkbox to do that).
Step 3: Visualize
- Select a chart type: Datawrapper offers basic, versatile chart types. You can experiment, which type is best for your data.
- Header and description: Tell your story, help the user to understand what is displayed in the chart.
- Mark-up single lines or row that are important (if needed).
- Additional features: Depending on the chart type you use there are a number of options to make sure that your chart is displayed correctly.
Step 4: Publish and embed
- In the last step Datawrapper generates an embed code. You can adapt the size freely and then embed your chart into any website, using either a content management system or weblog software.
Supported Browsers
Charts created with Datawrapper are optimized for HTML5. In modern browsers such as Firefox, Chrome, Safarai and newer versions of Internet Explorer they will display correctly. For users with older browsers Datawrapper generates a static image, loosing some of th interactive features. This image is created automatically.